

Reporting & analytics
Complete insight into how your padel school is performing. From lesson overviews to financial reports — export professional PDF reports and review KPIs in the analytics dashboard.
About this feature
What does Reporting & analytics do?
PadelPlanning's reporting centre gives you a complete view of your school at any moment. With more than 10 report types — lessons, rosters, instructors, players, locations, cancellations, open slots and financial — you always have the right data to hand. Every report can be exported as a professional PDF. The analytics dashboard shows visual charts of KPIs such as occupancy rate, revenue trends and player growth. Financial reports show revenue, refunds and credit movements — ready as input for your accountant.
Who it's for
Who benefits
- School administrators who want to monitor KPIs
- Finance leads who need to report on revenue
- Managers who want to optimise occupancy rates
- Clubs that want to make data-driven decisions
How it works
How does it work?
Review the dashboard
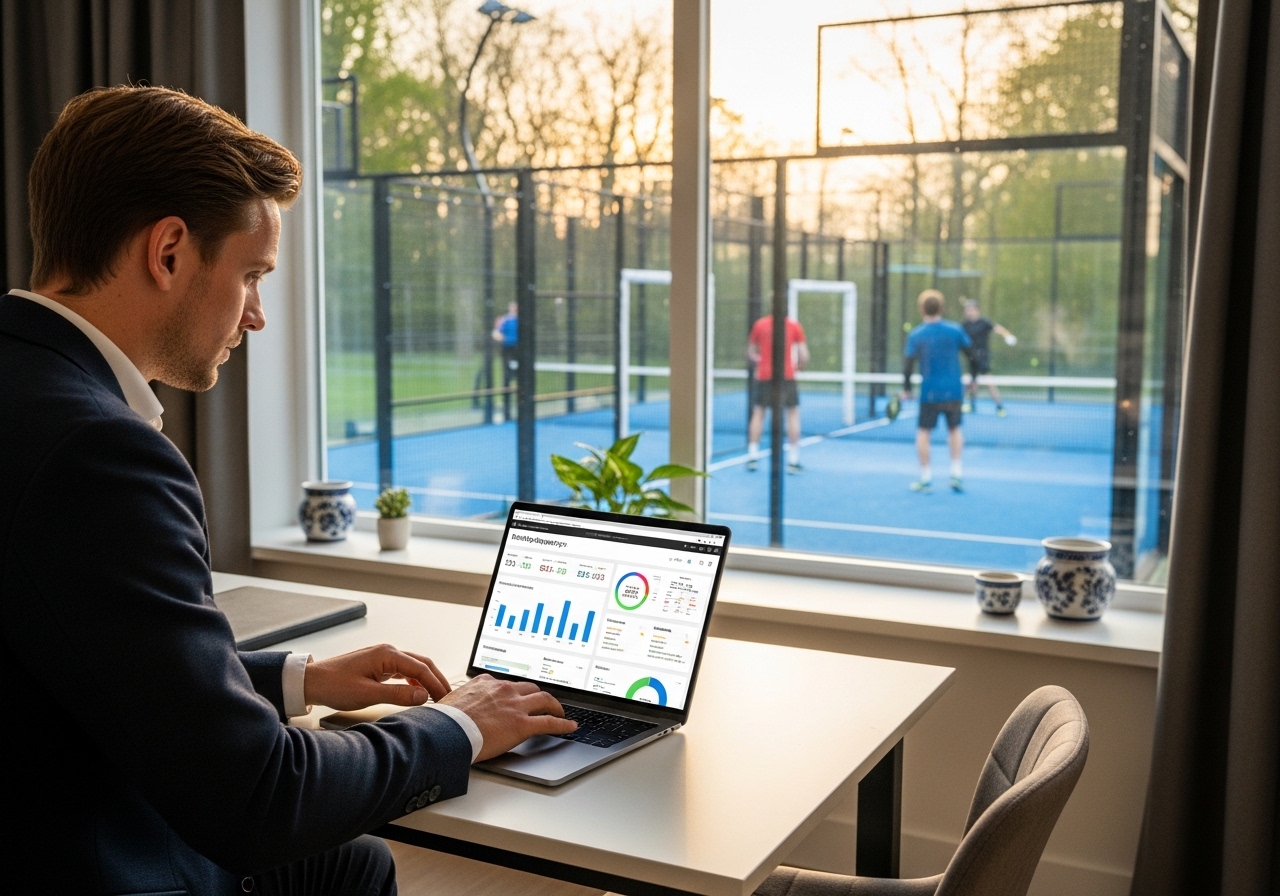
Open the analytics dashboard for a visual overview of your KPIs: occupancy rate, revenue, new players and popular lesson times.
Select a report
Choose from more than 10 report types, set the period you want and filter by location, instructor or player group.
Export
Export the report as a professional PDF and send it straight to your accountant, management or board members.

“I send the financial report straight to my accountant every month. I used to put it together by hand in Excel.”
— Administrator, Dutch padel school
Free demo
See this in your personal demo
In a 30-minute demo you'll see how Reporting & analytics works for your specific situation. We'll show you live how to save more time and serve your players better.
- A personal walkthrough, tailored to you
- All your questions answered
- No commitment or card required
- Scheduled within 1 working day
Available in
Included in every paid plan
We reply within 1 working day